
Even as we speak, our project’s digital humanities experts are adding the finishing touches to nearly two years’ worth of work. They are tweaking and reworking the scripts for the last time, running the data through the classifiers, and working hard to render their methods explainable and transparent to any technically minded future researcher who might wish to learn from what has been achieved. It’s been a long journey since April 2020, when they first received ethics approval to begin collecting data from Twitter’s Application Programming Interface (API), on a little Raspberry Pi computer. From then until now, they have been integral to our research into Covid Rumours in Historical Context, actively collaborating with the historians to realise the project’s goals. In this blog, we’ll take a look at the often-unsung hours of work that go into the management and computational analysis of well over 34 million tweets, as well as the novelty of the interdisciplinary teamwork practised on this project, and where this new approach fits within the School of Advanced Study and the Digital Humanities more broadly.
One of the project’s founding intentions was to carry out diachronic linguistic analysis, that is to say, analysis of shifts in meaning within semantic fields over time. At nearly two years old, it has run for longer than the typical projects in this field, collecting 570 days’ worth of Twitter data. This major, longitudinal study, allowed researchers to chart changes in the frequency of key terms against a timeline of the Coronavirus pandemic, gleaning many valuable insights. However, gathering all of this data was far from straightforward. Collection began in April 2020, with a brief interruption during December, before resuming in January 2021. This, and other complications necessitated the division of the data into three large groups, or ‘corpora’, which we named using the Greek letters, Alpha, Beta and Gamma. The researchers used a software called ‘twarc’, which is a command-line utility that tracks the hashtags or words you want to follow on Twitter, periodically dumping the data in the form of JavaScript objects into a file. It was configured to rotate nightly, producing daily files which were more conveniently sized for data management purposes. As the collection process continued, the methodologies for analysing the data were gradually emerging.
From the outset, the approach to this project was exploratory, open-minded, and inquisitive. The computational techniques available did not dictate the methodology and shape of the research, but rather, artificial intelligence and other software components were chosen in accordance with how well they could answer the questions being asked of the data. In the end, this led to a combination of unsupervised machine learning algorithms, such as those used in topic modelling, and supervised machine learning classifiers, which needed humans to annotate and input training data. Then there were also the tools used at the end of the process, to conduct and present linguistic analyses. These included Ngrams (a word frequency method), Pointwise Mutual Information (a method for normalising the meaningfulness of linguistic associations), and integrated network visualisations (the components of the dashboard) which was essentially the user interface from which to conduct queries of the data to explore and contrast the diachronic and categorical semantics within the corpus. However, behind all of these tools and techniques were a lot of false starts, incremental ingenuity and hard work from the computer scientists themselves.
There is a common misconception of what it means to use machine learning, AI and similar computational techniques; that it is merely a matter of a few clicks, and the machine performs the rest of the labour. This is almost never the case! While machine learning tools were undoubtedly useful for categorising information at scales that human researchers could not contemplate achieving in their lifetimes, they are hardly the panacea of computing that we often consider them to be. Instead, an enormous amount of effort had to go into the data management, or data ‘wrangling’, to oversee multiple changes in structure and format, to clean and pre-process the initial data dumps, and to regularly share intermediate results with the research team.
Cleaning processes involved removing problematic records, deleting duplicates (in cases where backups had to be run due to power outages and gathered data that overlapped with previously collected records), as well as ‘rechunking’ the data into daily files. The raw data arrived in the JSONL, a JavaScript Object Lines format, which is not easily human legible. Twitter text is notoriously different from ordinary language, encompassing emojis, URLs, multi-lingual words within single tweets, spam, junk, the plethora of obvious product marketing tweets, as well as the more familiar ever-changing portmanteaus of trending hashtags, such as #covidiot, #plannedemic. This meant that in order for the researchers to annotate a small sample of tweets on which to train the classifiers, this sample had to be identified, refined and extracted from the larger corpus, before being converted into the legible html format for verification. Moreover, as data security was of primary importance, these sample tweets had to be shared with team members in password-protected online formats. As you can see, simply managing the data was a major task, let alone viewing and analysing it.
When it came to the analysis, our project was unusual for the extent of the collaboration between researchers from different areas of expertise, especially when training the classifiers and building taxonomies of words of interest for the research. The advantage of this approach was the cross-pollination of insights from the historical research and the digital humanities that occurred, for instance, in enabling concepts from the historical case studies to inform the organisation of the contemporary data, thereby aiding comparison. The final taxonomies that emerged were, therefore, the product of a multi-month dialogue between the data and the researchers, mediated by the data analysis tools.
This process began by using topic modelling, to collect words and associations and give the researchers an impression of the clusters of themes that characterised the corpus. The historians then contributed categories of terms of interest from the historical sources, which were fed back into the data to see what else emerged, and so on and so forth for several iterations. A useful assistant in this task, was Word2vec, a word vector model capable of mathematically predicting similar words to the inputted lists of ‘seed’ words. This really helped the taxonomy of words grow, and eventually crystalize into a fully developed hierarchy of categories and subcategories, into which to organise the data. At this stage, a classifying software called Prodigy was used, which learned from the data annotations of the researchers how to categorise tweets into four distinct subject groups: Conspiracy, Cures, Origins and Vaccines.
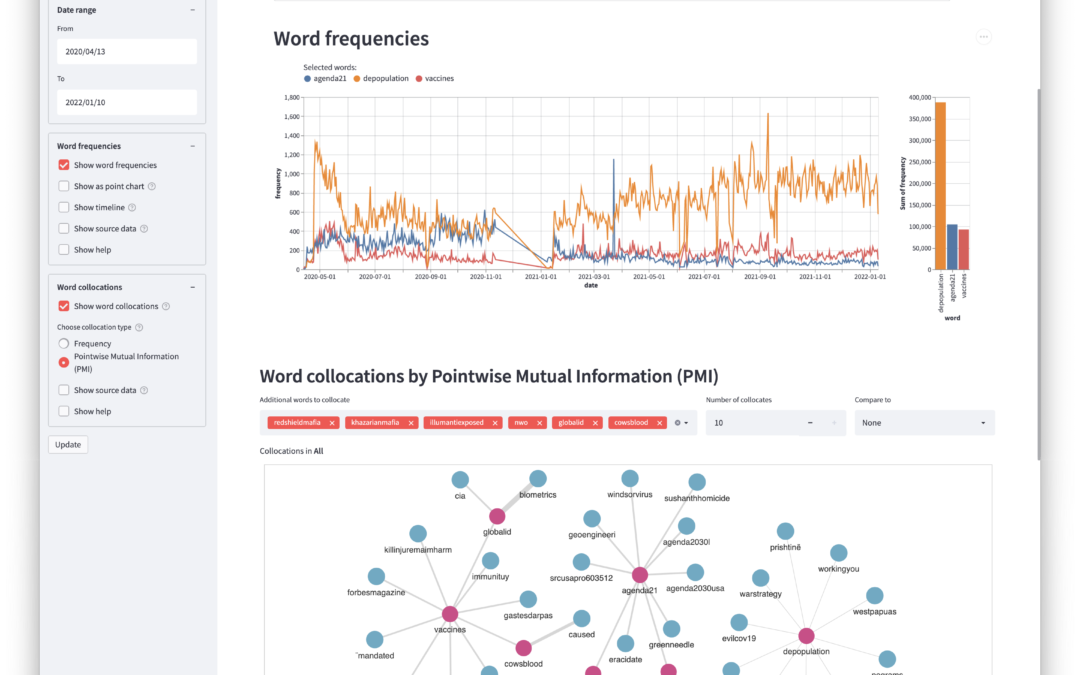
All the many facets that we were trying to compare categorically and diachronically, came together in the custom-built dashboard; the interface for exploring and analysing the data. For data security and the anonymity of Twitter users, the dashboard runs on derived data, rather than the original tweets, and is cryptographically connected to the raw data which is stored securely in the cloud. After all the hard work, this was the moment that the team could search for and explore the semantic connections between keywords, which the dashboard could visualise beautifully (see above). It was also possible to explore frequency spikes in word usage, with reference to a timeline of the pandemic. This helped clarify the causal or acausal relationship between events in the physical and digital worlds.
While no single component of this research is unique, the way in which the researchers collaborated does represent something new and exciting in this field. Traditionally, the data gathering, processing and analysis would be outsourced to a technical team, who would be ancillary to the project, with little interest from the rest of the research team in the processes behind the results they received. In our project, by contrast, this technical work was not merely a service component, but rather a frontier on which all of the researchers came together to problem-solve, ask questions, and consult one another. Instead of remaining in hermetically sealed areas of expertise, we dared to share with and learn from one another. Perhaps reflective of the historical rather than social science sensibility that predominated on this project, the approach to the data was also unusual for Digital Humanities research. Instead of seeking to disprove or confirm a hypothesis, using computational techniques in a very hands-off way, there was active feedback into the data of concepts informed by historical case studies. Moreover, the annotation work enabled researchers to develop a subjective sense for the themes in the corpus, which later proved invaluable. Thus, all levels of this research project were bilateral rather than unilateral in character.
London University’s School of Advanced Study (SAS) occupies a special place in the Digital Humanities in this country, at the very forefront of the developing relationship between humanities and digital humanities researchers. Our project, based at the SAS, exemplified this new generation of well-integrated, well budgeted, and truly collaborative research. It has been a thoroughly refreshing challenge to all the participants, to overcome the boundaries of their discreet, expert languages, and pursue research on a truly equal footing. This is part of a broader movement that is taking place in the Digital Humanities today, as we update our conceptions of the field to reflect its gradual shift from digitisation to data science, and all the possibilities that this reframing of the field might entail. As Winston Churchill said, in a much less optimistic spirit than I quote him now, “This is not the end. It is not even the beginning of the end. But it is, perhaps, the end of the beginning.”
Here is an example of the dashboard in action:
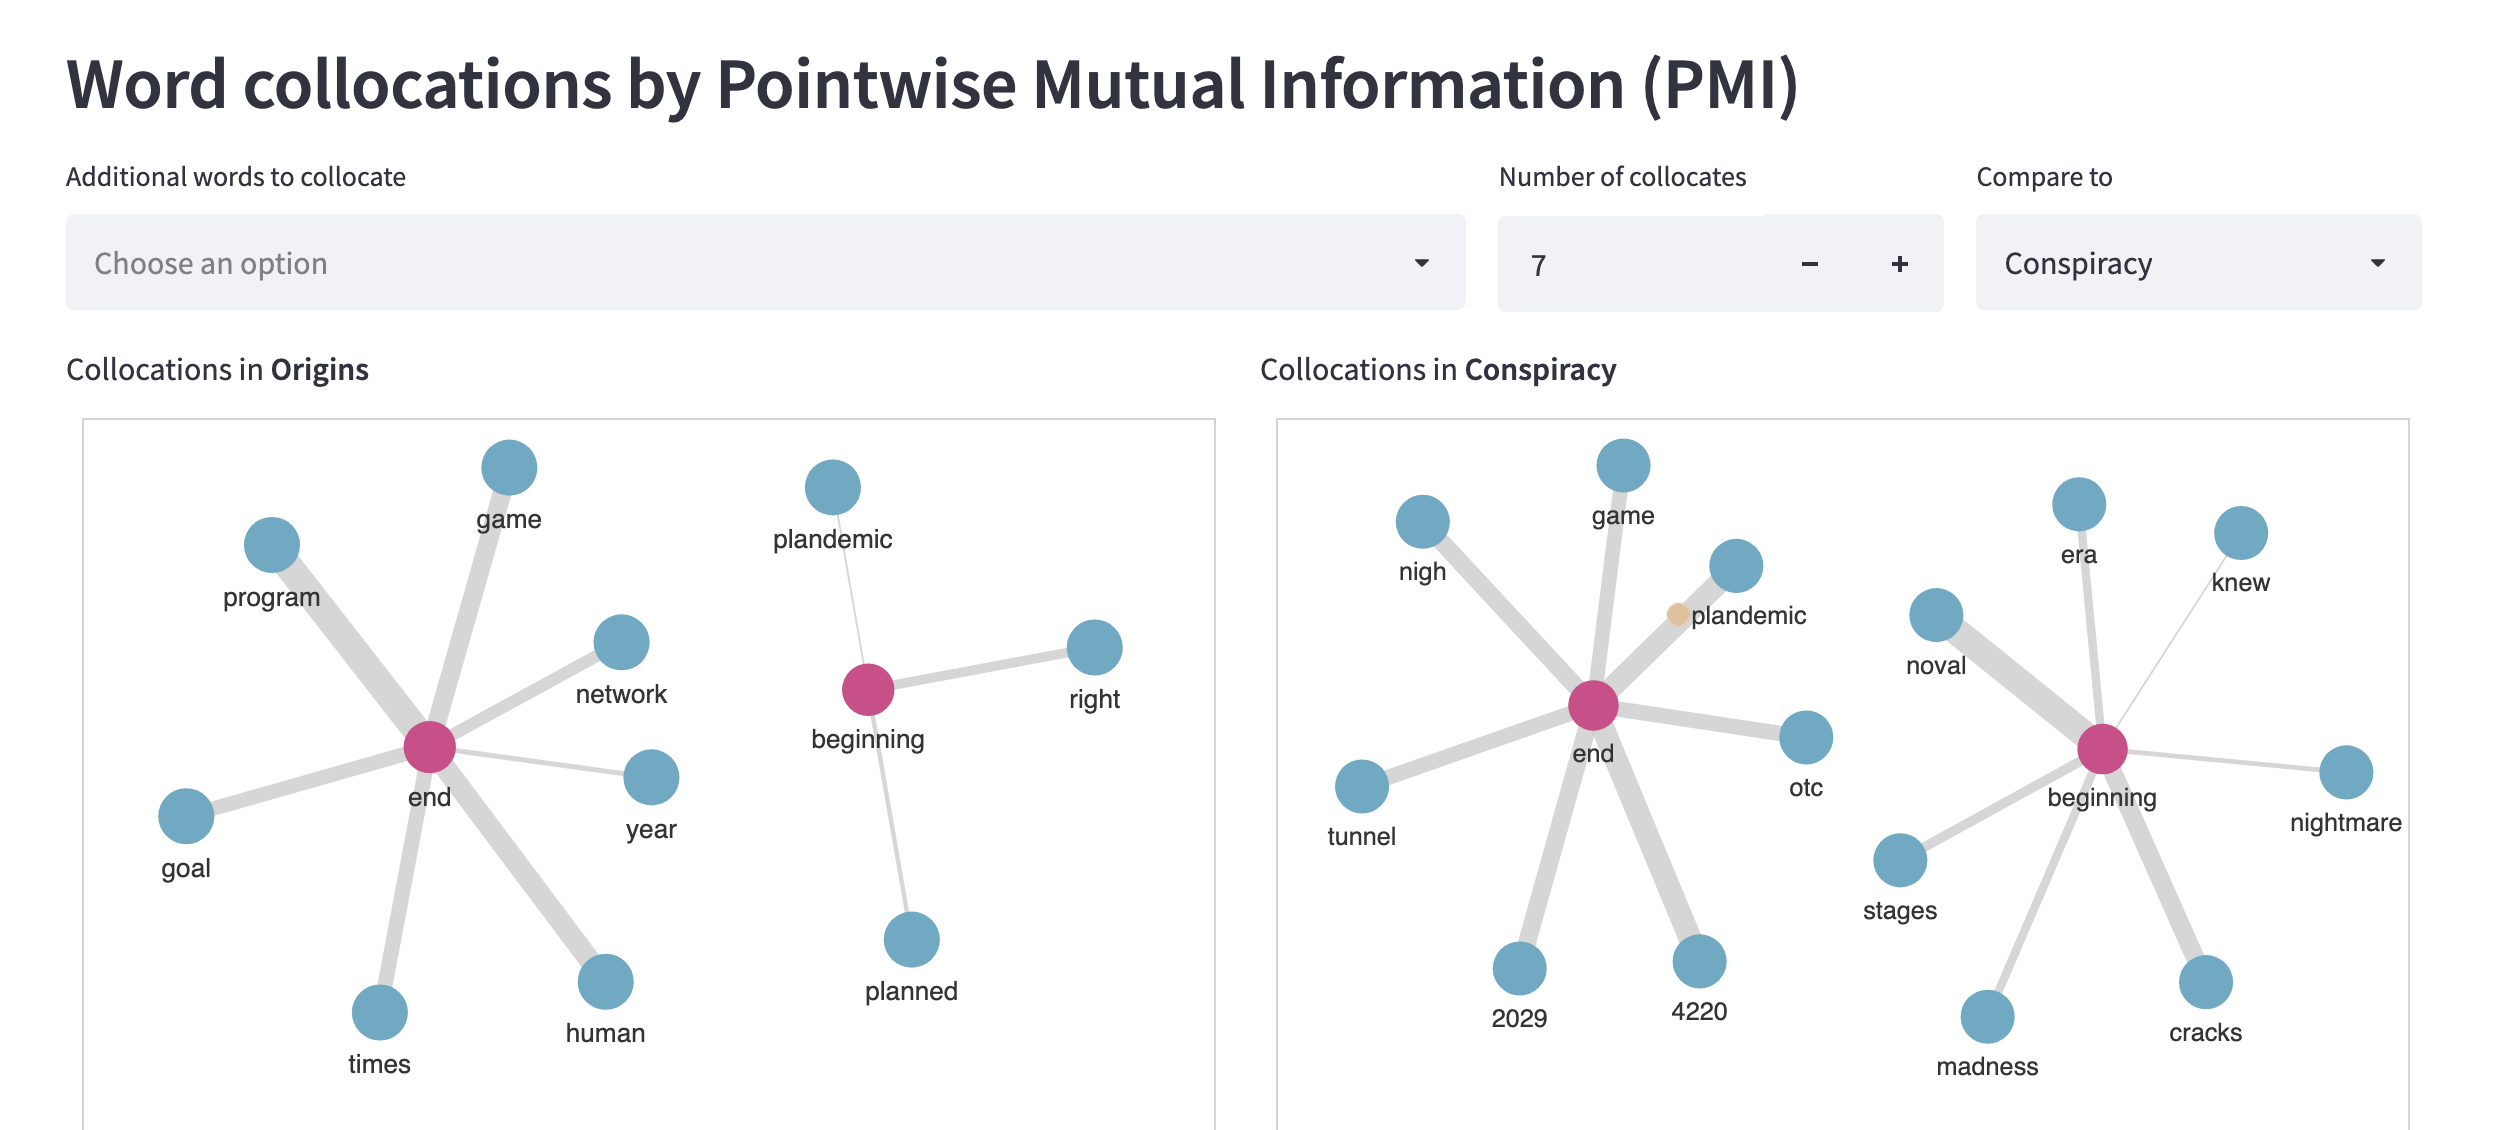
Word collocations for ‘beginning’ and ‘end’ in Origins and Conspiracy categories from April 2020 to January 2021:
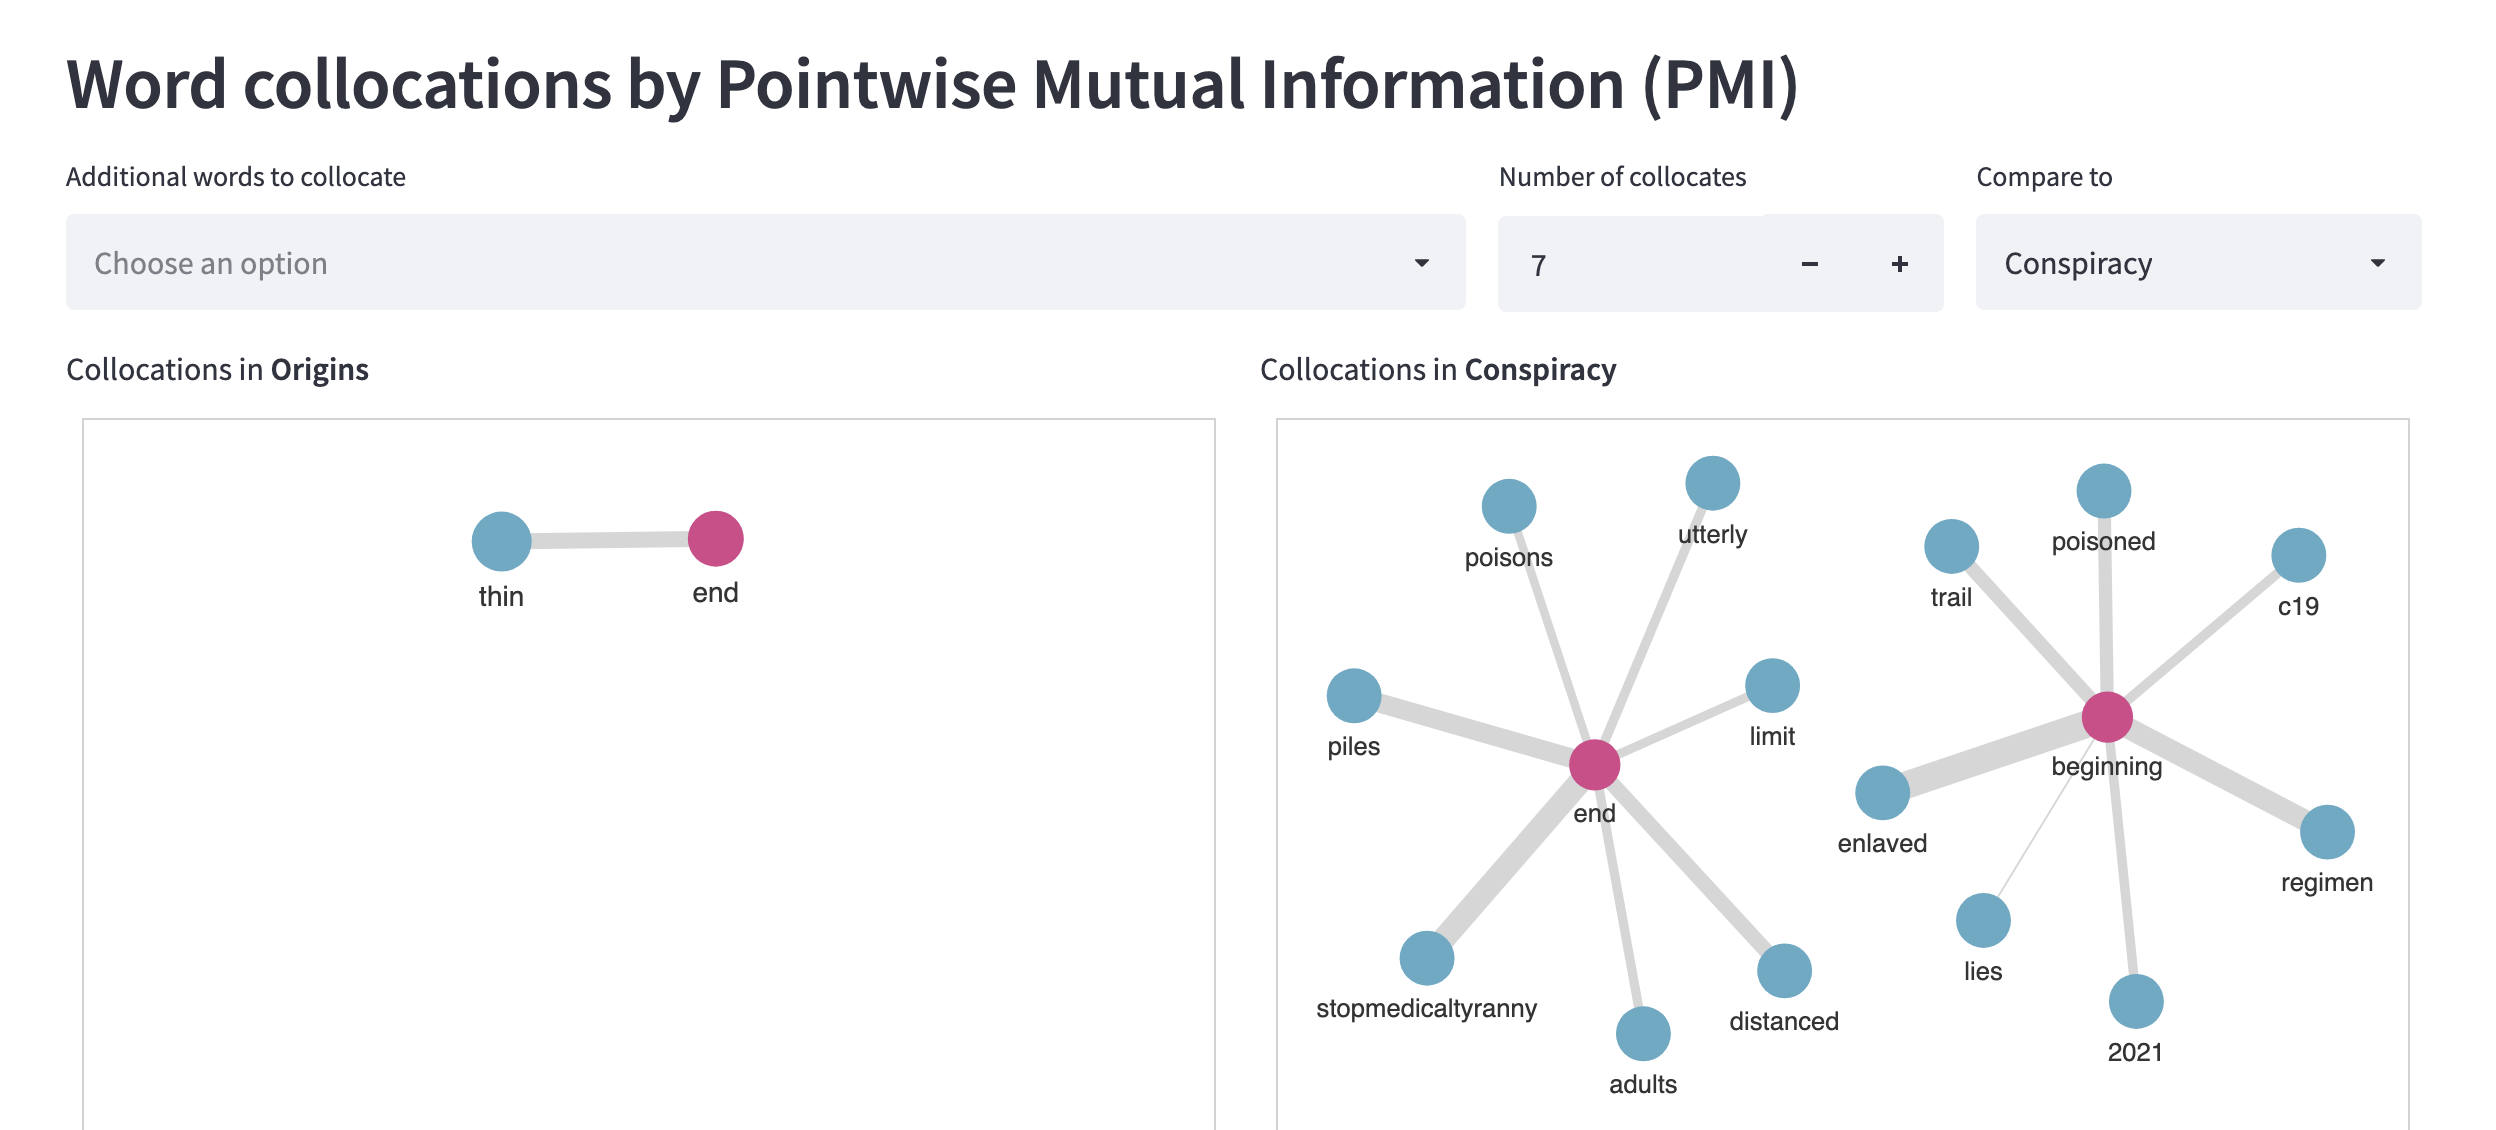
Word collocations for ‘beginning’ and ‘end’ in Origins and Conspiracy categories from April 2021 to January 2022:
Recent Comments